AI-Powered Analytics
Turn Feedback Into Strategic Decisions
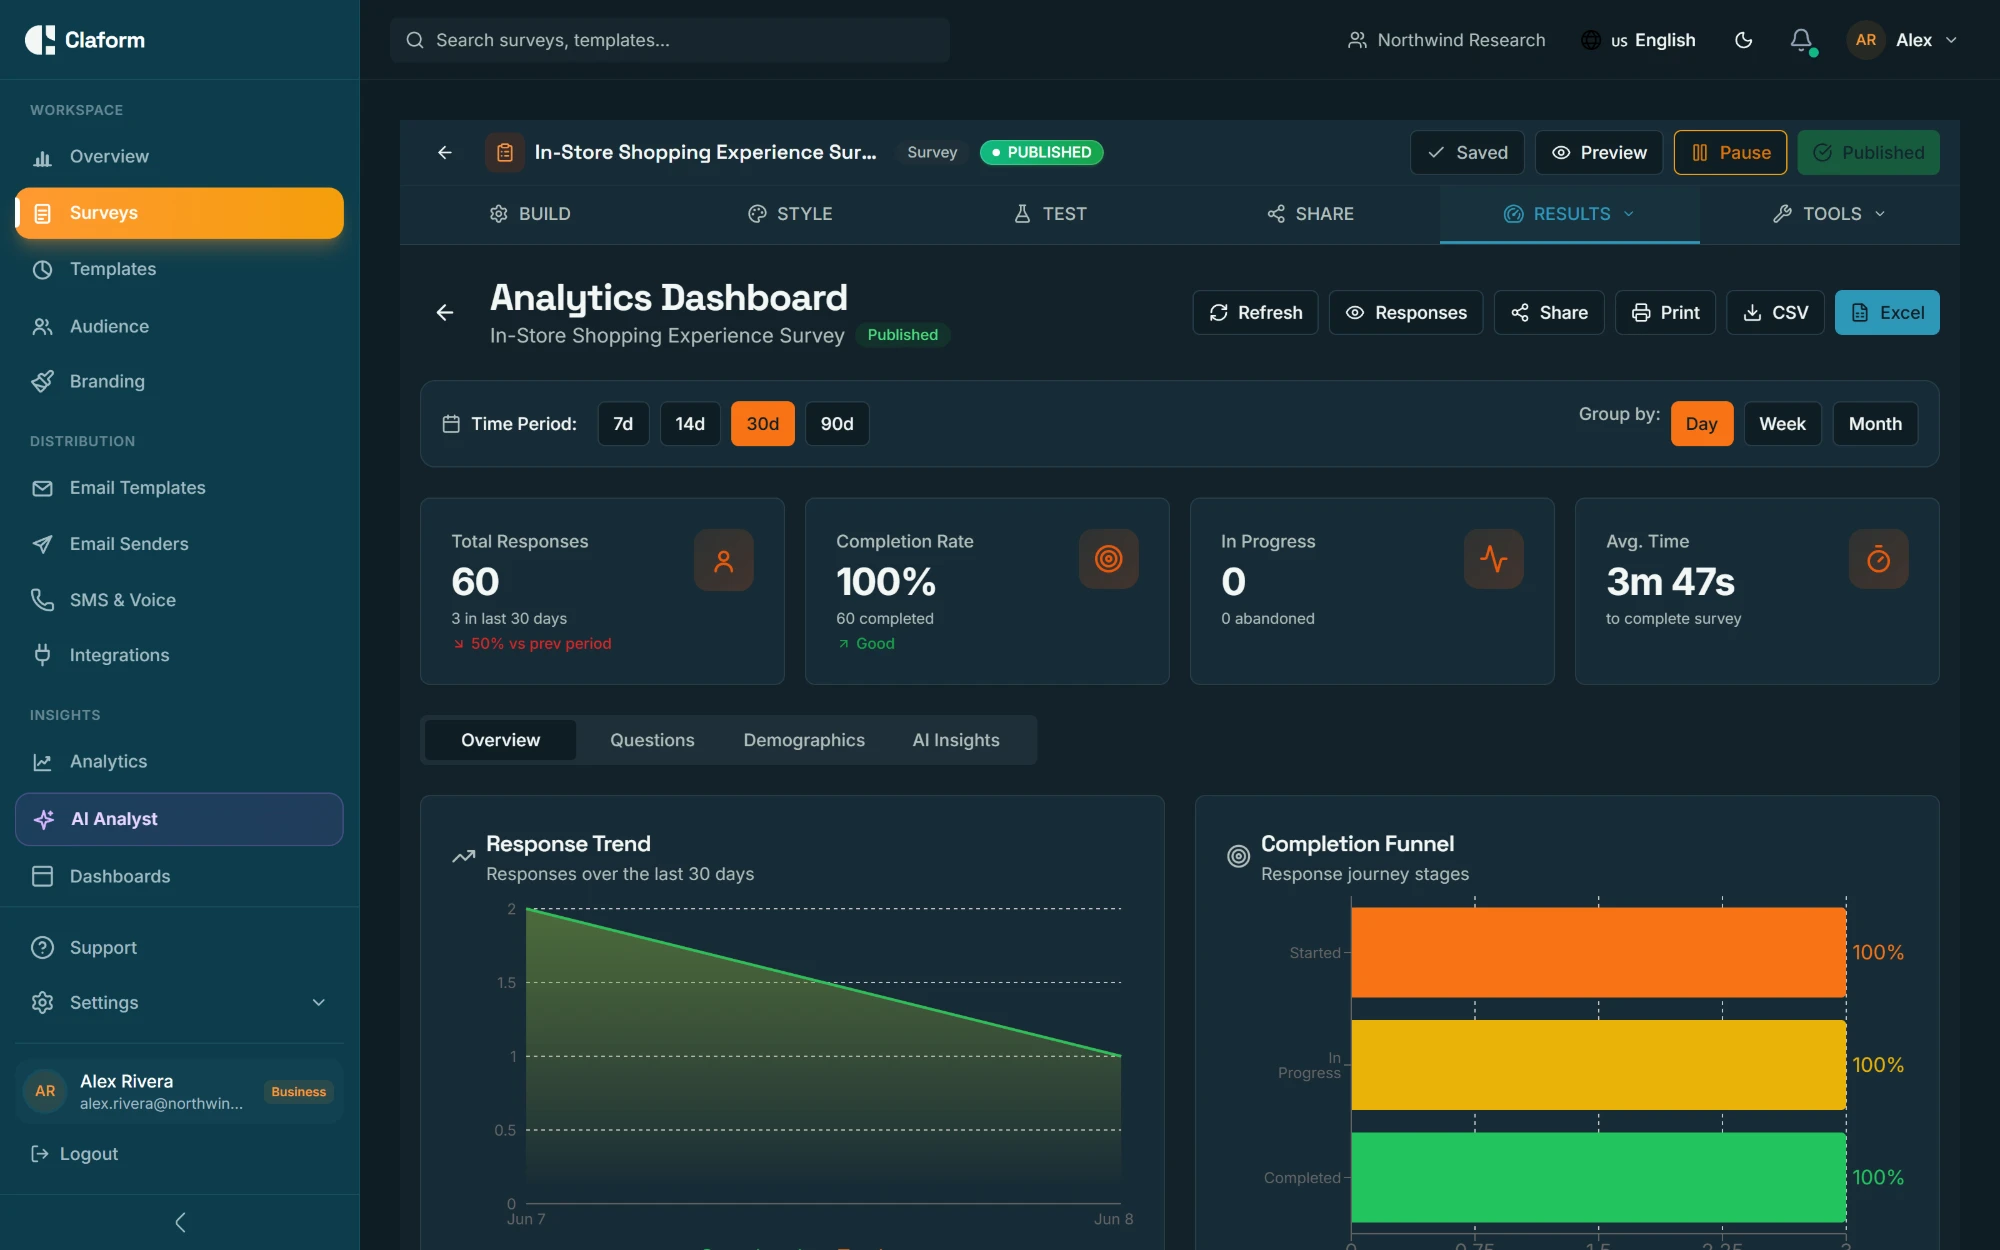
Go beyond charts and percentages. Our AI-powered analytics engine predicts churn, scores customer health, detects sentiment, and delivers actionable recommendations -- all in real time. Custom dashboards and benchmarks across 20 industries put context at your fingertips.
AI Insights
Predictive Intelligence, Not Just Reports
Traditional analytics tell you what happened. Our AI tells you what will happen next and what to do about it.
Churn Prediction
Our AI models analyze response patterns, sentiment shifts, and engagement metrics to identify accounts at risk of churning. Get early warnings weeks before customers leave, giving your team time to intervene with targeted retention strategies.
Health Scoring
Aggregate multiple feedback signals into a single health score for each customer, segment, or product area. The AI weighs recency, frequency, sentiment, and NPS trends to produce an intuitive 0-100 score that updates with every new response.
Smart Recommendations
Receive actionable recommendations based on your data. The AI identifies which survey questions drive the most insight, suggests optimal send times, recommends follow-up actions, and highlights statistically significant changes that require attention.
Sentiment Analysis
Understand the Emotion Behind Every Response
NLP-powered sentiment analysis processes open-text responses in real time, detecting tone, emotion, and intent so you can act on qualitative feedback at quantitative scale.
Tone Detection
Classify open-text responses as positive, negative, neutral, or mixed with confidence scores
Emotion Analysis
Detect specific emotions like satisfaction, frustration, excitement, and disappointment
Intent Recognition
Identify whether respondents plan to buy, churn, recommend, or escalate
Trend Tracking
Monitor sentiment shifts over time with automatic change detection and alerting
Topic Clustering
Automatically group open-text responses into themes and topics for fast analysis
Executive Summaries
AI-generated narrative summaries of key findings, ready for stakeholder presentations
Dashboards
Real-Time Dashboards with 8 Widget Types
Build the exact dashboard you need. Drag and drop widgets, configure data sources, set filters, and share with your team. Every chart updates live as new responses arrive.
Bar Chart
Compare categories with horizontal or vertical bar charts, stacked or grouped
Pie / Donut Chart
Show proportions and composition with customizable slices and labels
Line Chart
Track trends over time with multi-series, annotations, and goal lines
Metric Card
Highlight a single KPI with trend indicator, sparkline, and comparison period
Data Table
Display raw or aggregated data with sorting, filtering, and conditional formatting
Cross-Tab Matrix
Break down one question by another to reveal correlations and segments
Text Block
Add headings, descriptions, and context between charts for narrative flow
Trend Sparkline
Compact inline charts showing directional trends within table rows or cards
Dashboard Capabilities
Our dashboard builder is designed for both analysts who need deep customization and executives who need at-a-glance summaries. Every dashboard is shareable, schedulable, and embeddable.
Benchmarks
Benchmark Against 20 Industries
Numbers without context are just numbers. Our benchmark database lets you compare your results against industry-specific standards so you know exactly where you stand.
NPS Benchmarks
See how your Net Promoter Score compares to leaders in your industry. Track whether you are above, at, or below the median, and identify what top performers do differently.
CSAT Benchmarks
Customer satisfaction scores vary significantly by industry. Our benchmarks give you the full distribution so you can set realistic targets and celebrate meaningful improvements.
Response Rate Benchmarks
Know whether your response rates are competitive. We track median response rates by distribution channel and industry, helping you optimize your outreach strategy.
Export & Share
Get Your Data Where It Needs to Go
Export reports in the format your stakeholders prefer, or pipe data directly into your BI tools via API.
PDF Reports
Branded, paginated PDF reports with charts, tables, and executive summary. Schedule daily, weekly, or monthly delivery to stakeholders.
Excel Workbooks
Multi-sheet Excel files with raw data, summary statistics, cross-tabulations, and charts. Ready for pivot tables and further analysis.
CSV Export
Clean, flat CSV files for import into any tool. Configurable column selection, date ranges, and encoding options.
SPSS Export
Export data in SPSS-compatible format for advanced statistical analysis in academic and research environments.
API Access
Programmatic access to all analytics data via REST API. Build custom reports, integrate with BI tools, or feed dashboards.
Stop Guessing. Start Knowing.
See what AI-powered analytics can reveal about your customers, employees, and market. Start free and upgrade when you need advanced insights.