Example scenario · Understand
Find out why the score is low
The answers come in and the score is bad. The AI summary, key drivers and a comparison by visit time show what is wrong, and when.
Real product, sample data from our demo café. Not a customer story.
The situation
An overall score said guests were unhappy. It did not say about what, or whether every visit was the same. Fixing everything at once was not an option.
How it works
- 01
Read the summary
The AI summary lists what is working and what is not, in plain words.
- 02
Find the driver
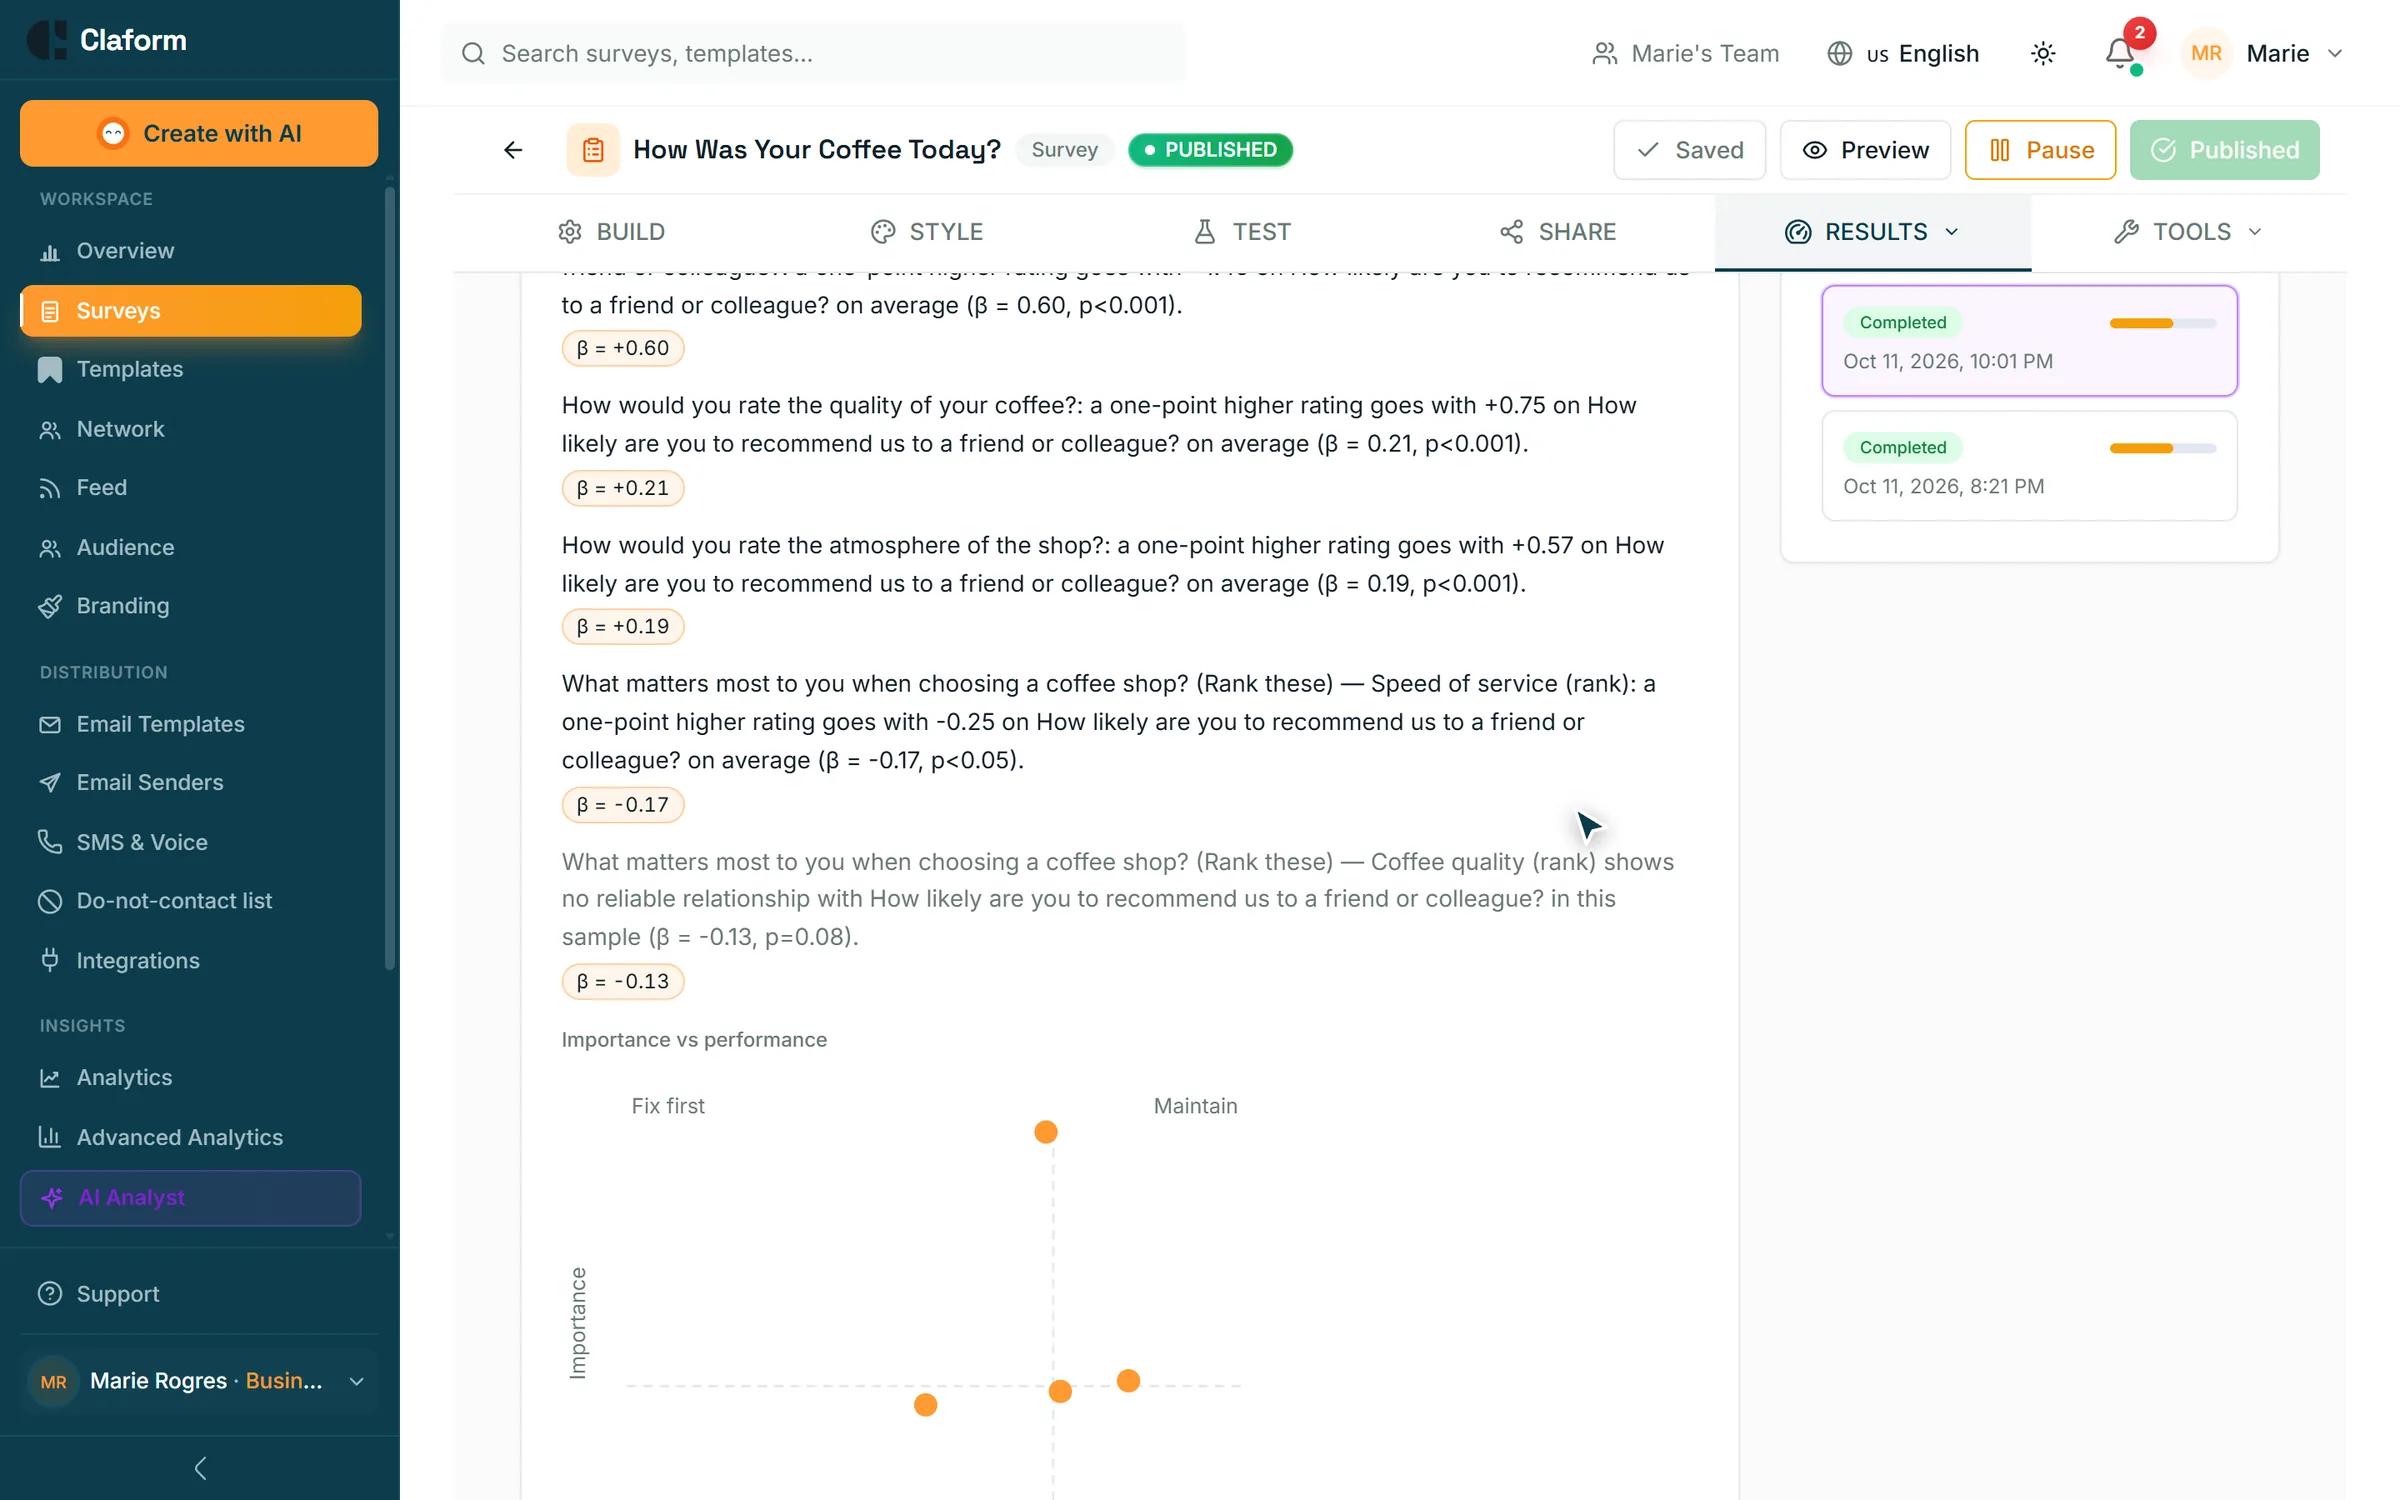
Key drivers show speed of service moves the recommend score the most.
- 03
Compare groups
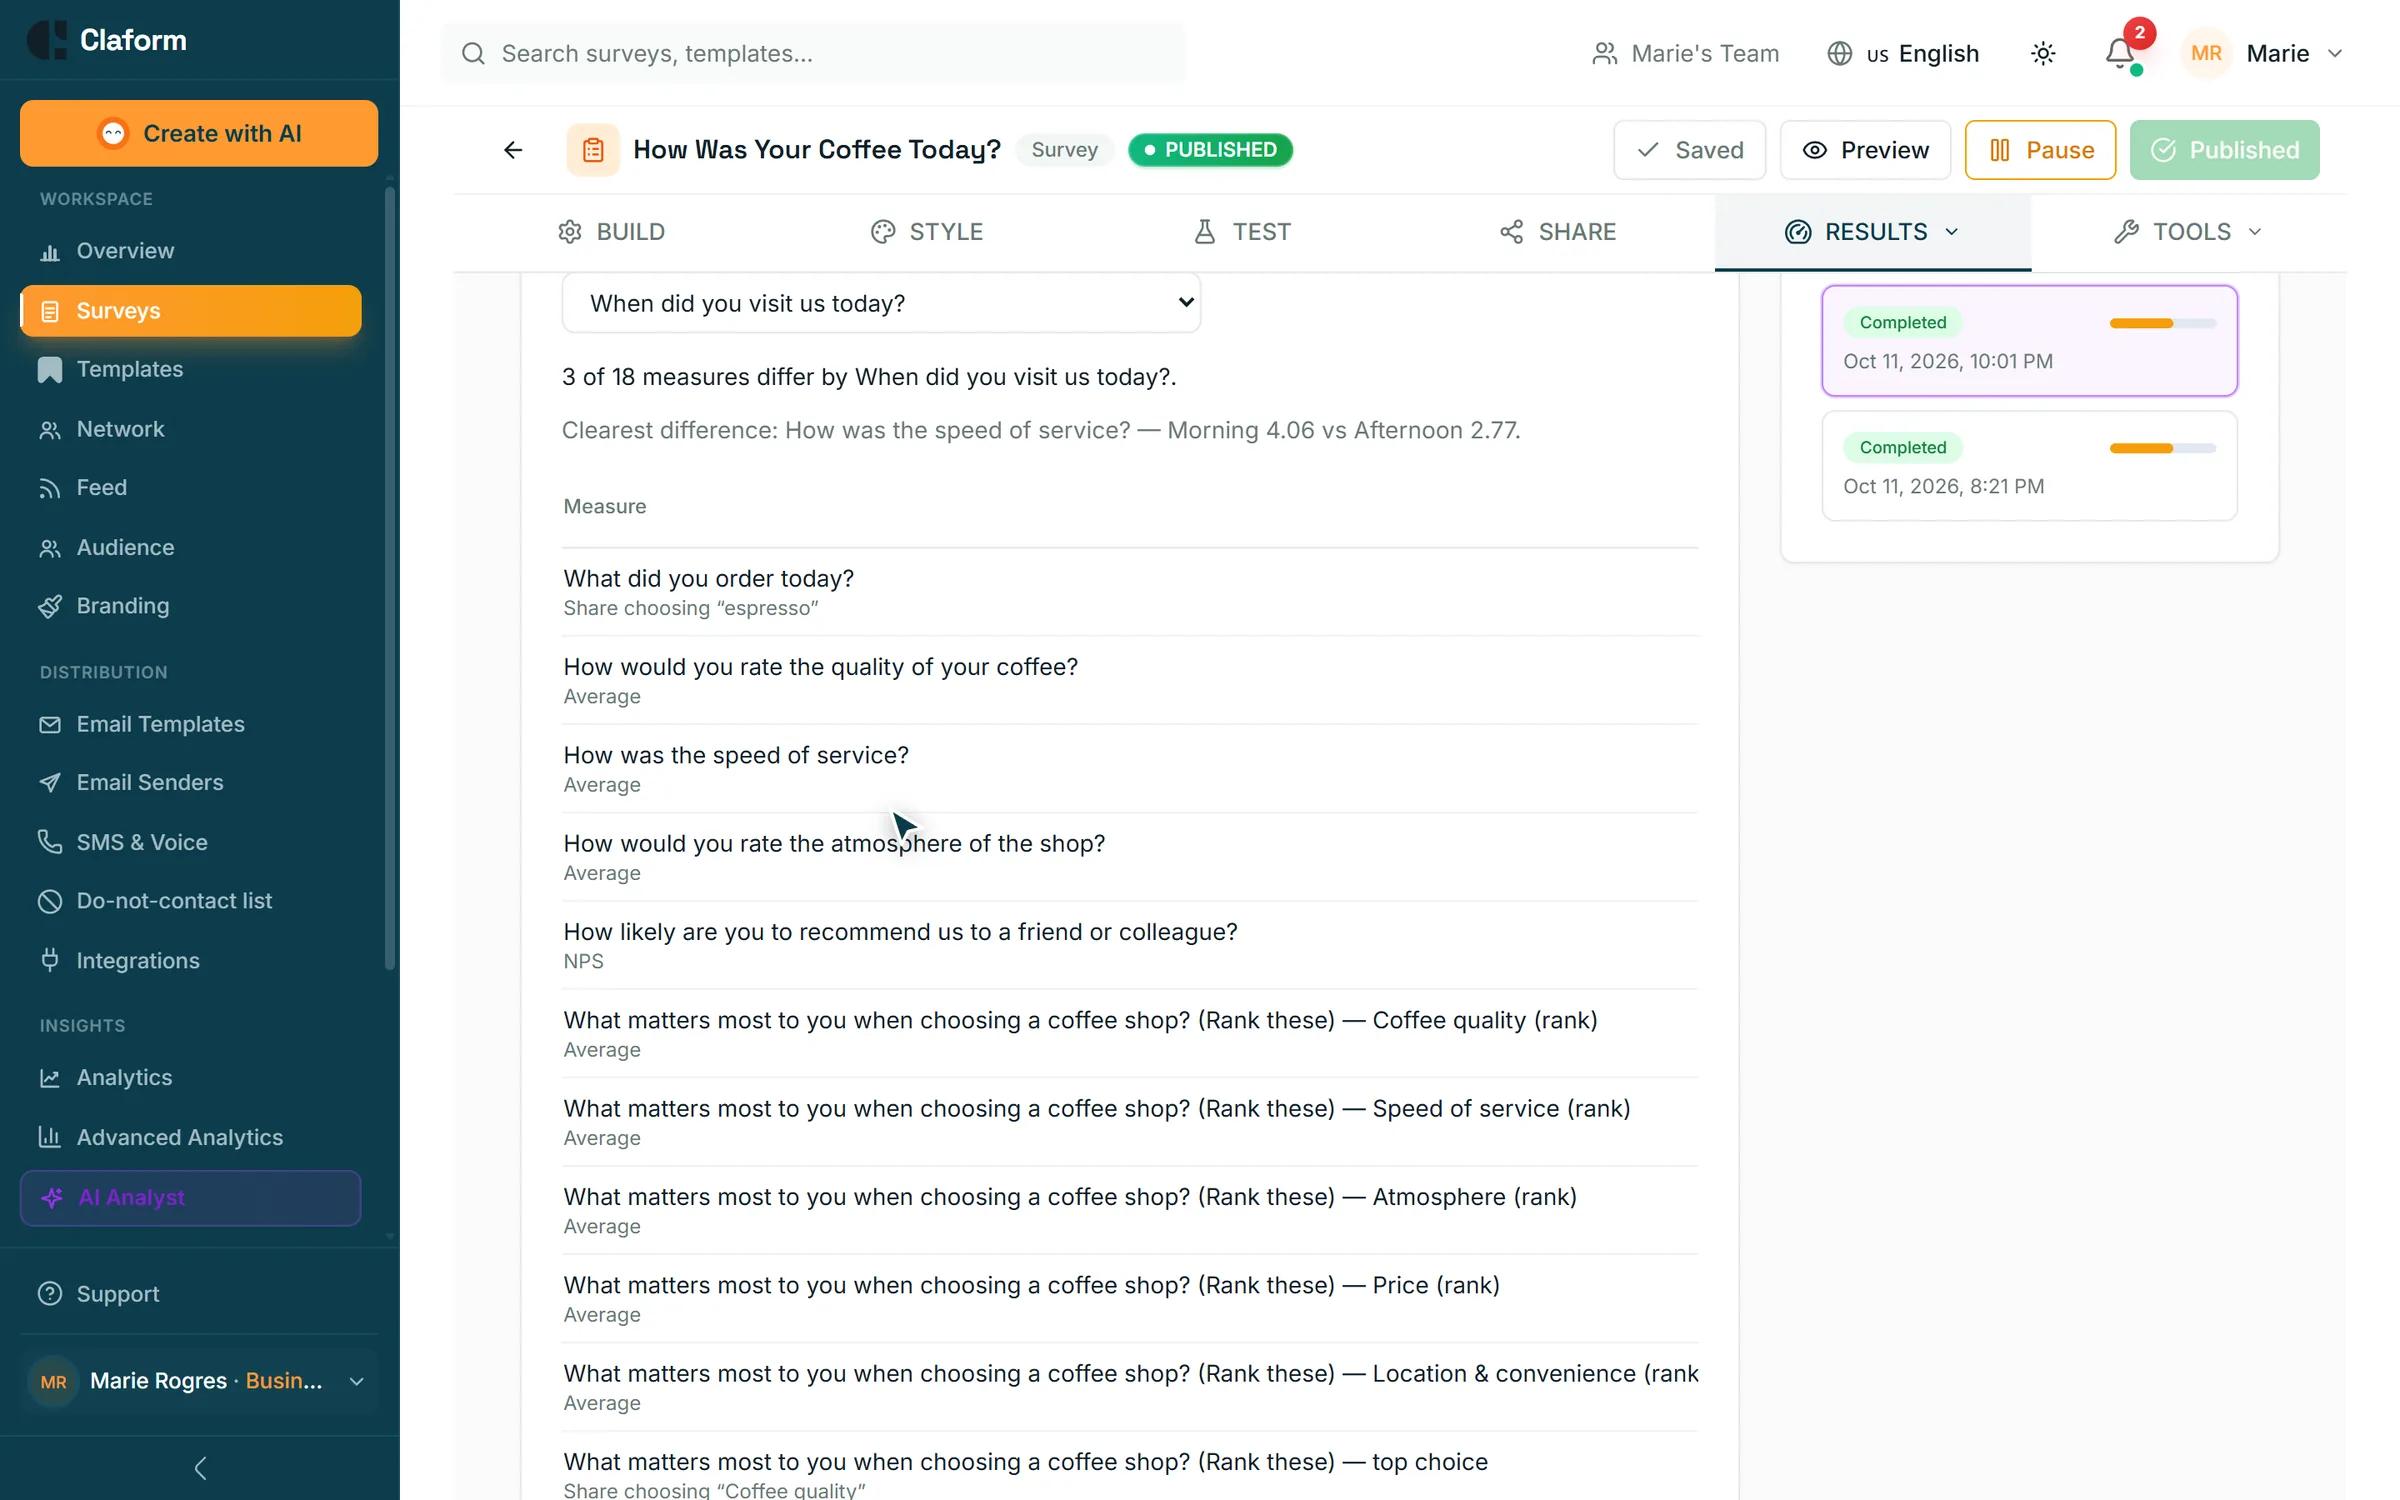
Split by "when did you visit": mornings 4.06, afternoons 2.77 for speed.
The screens
The results, summarised
The results page shows every answer as it arrives, and the AI summary turns them into a short read for the owner.
- Charts for every question
- Filters and exports
Key drivers, with the numbers
The AI Analyst ranks what moves the recommend score and shows the statistic behind each finding, so nobody has to take it on trust.
- Evidence on every finding
- Recommendations tied to that evidence
One average hid the problem
Comparing mornings and afternoons showed the slow service was an afternoon problem. One overall score would have blended the two.
- Compare by any question
- Small groups are left out, not guessed
The AI summary works on every plan with your monthly AI allowance. The AI Analyst is on Professional and above.
What the sample data says
Real product, sample data from our demo café. Not a customer story.
- Sample answers
- 241
- Net Promoter Score
- −5
- Speed of service, mornings
- 4.06
- Speed of service, afternoons
- 2.77
Other scenarios
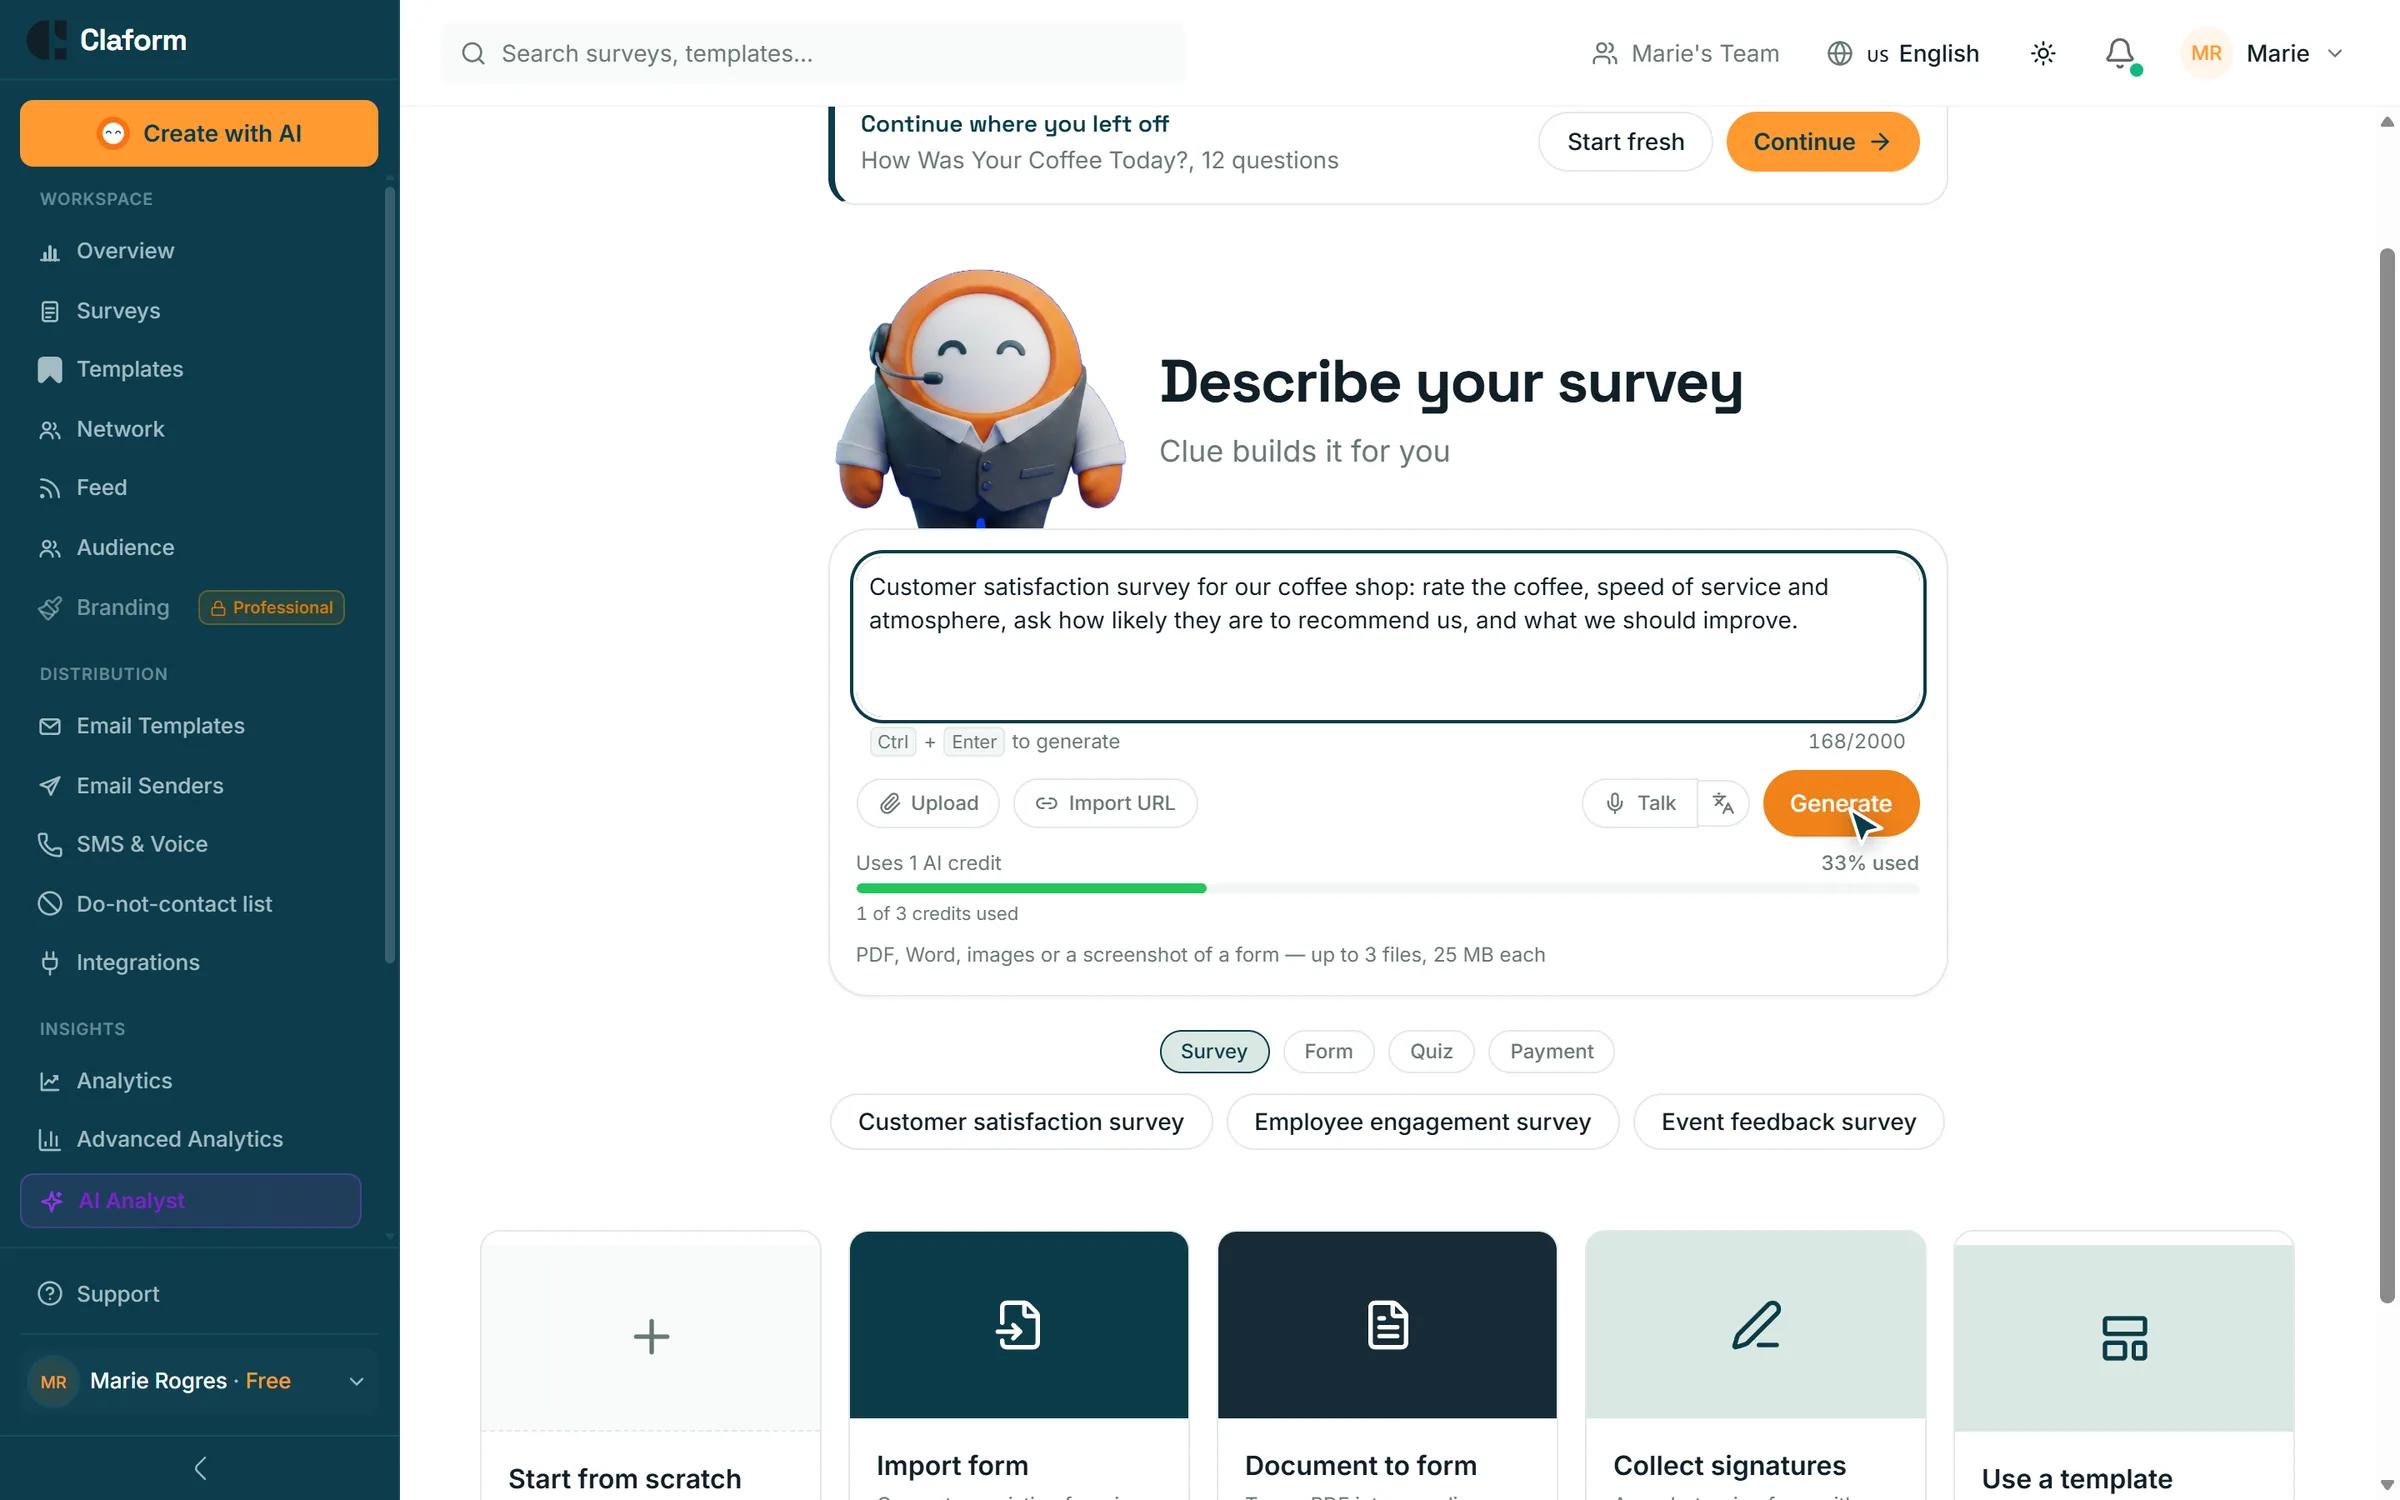 Ask every guest, starting from one sentenceCreate and shareThe owner types what she wants to learn. Clue writes the survey, and she shares it at the table, by SMS and by email.See the scenario
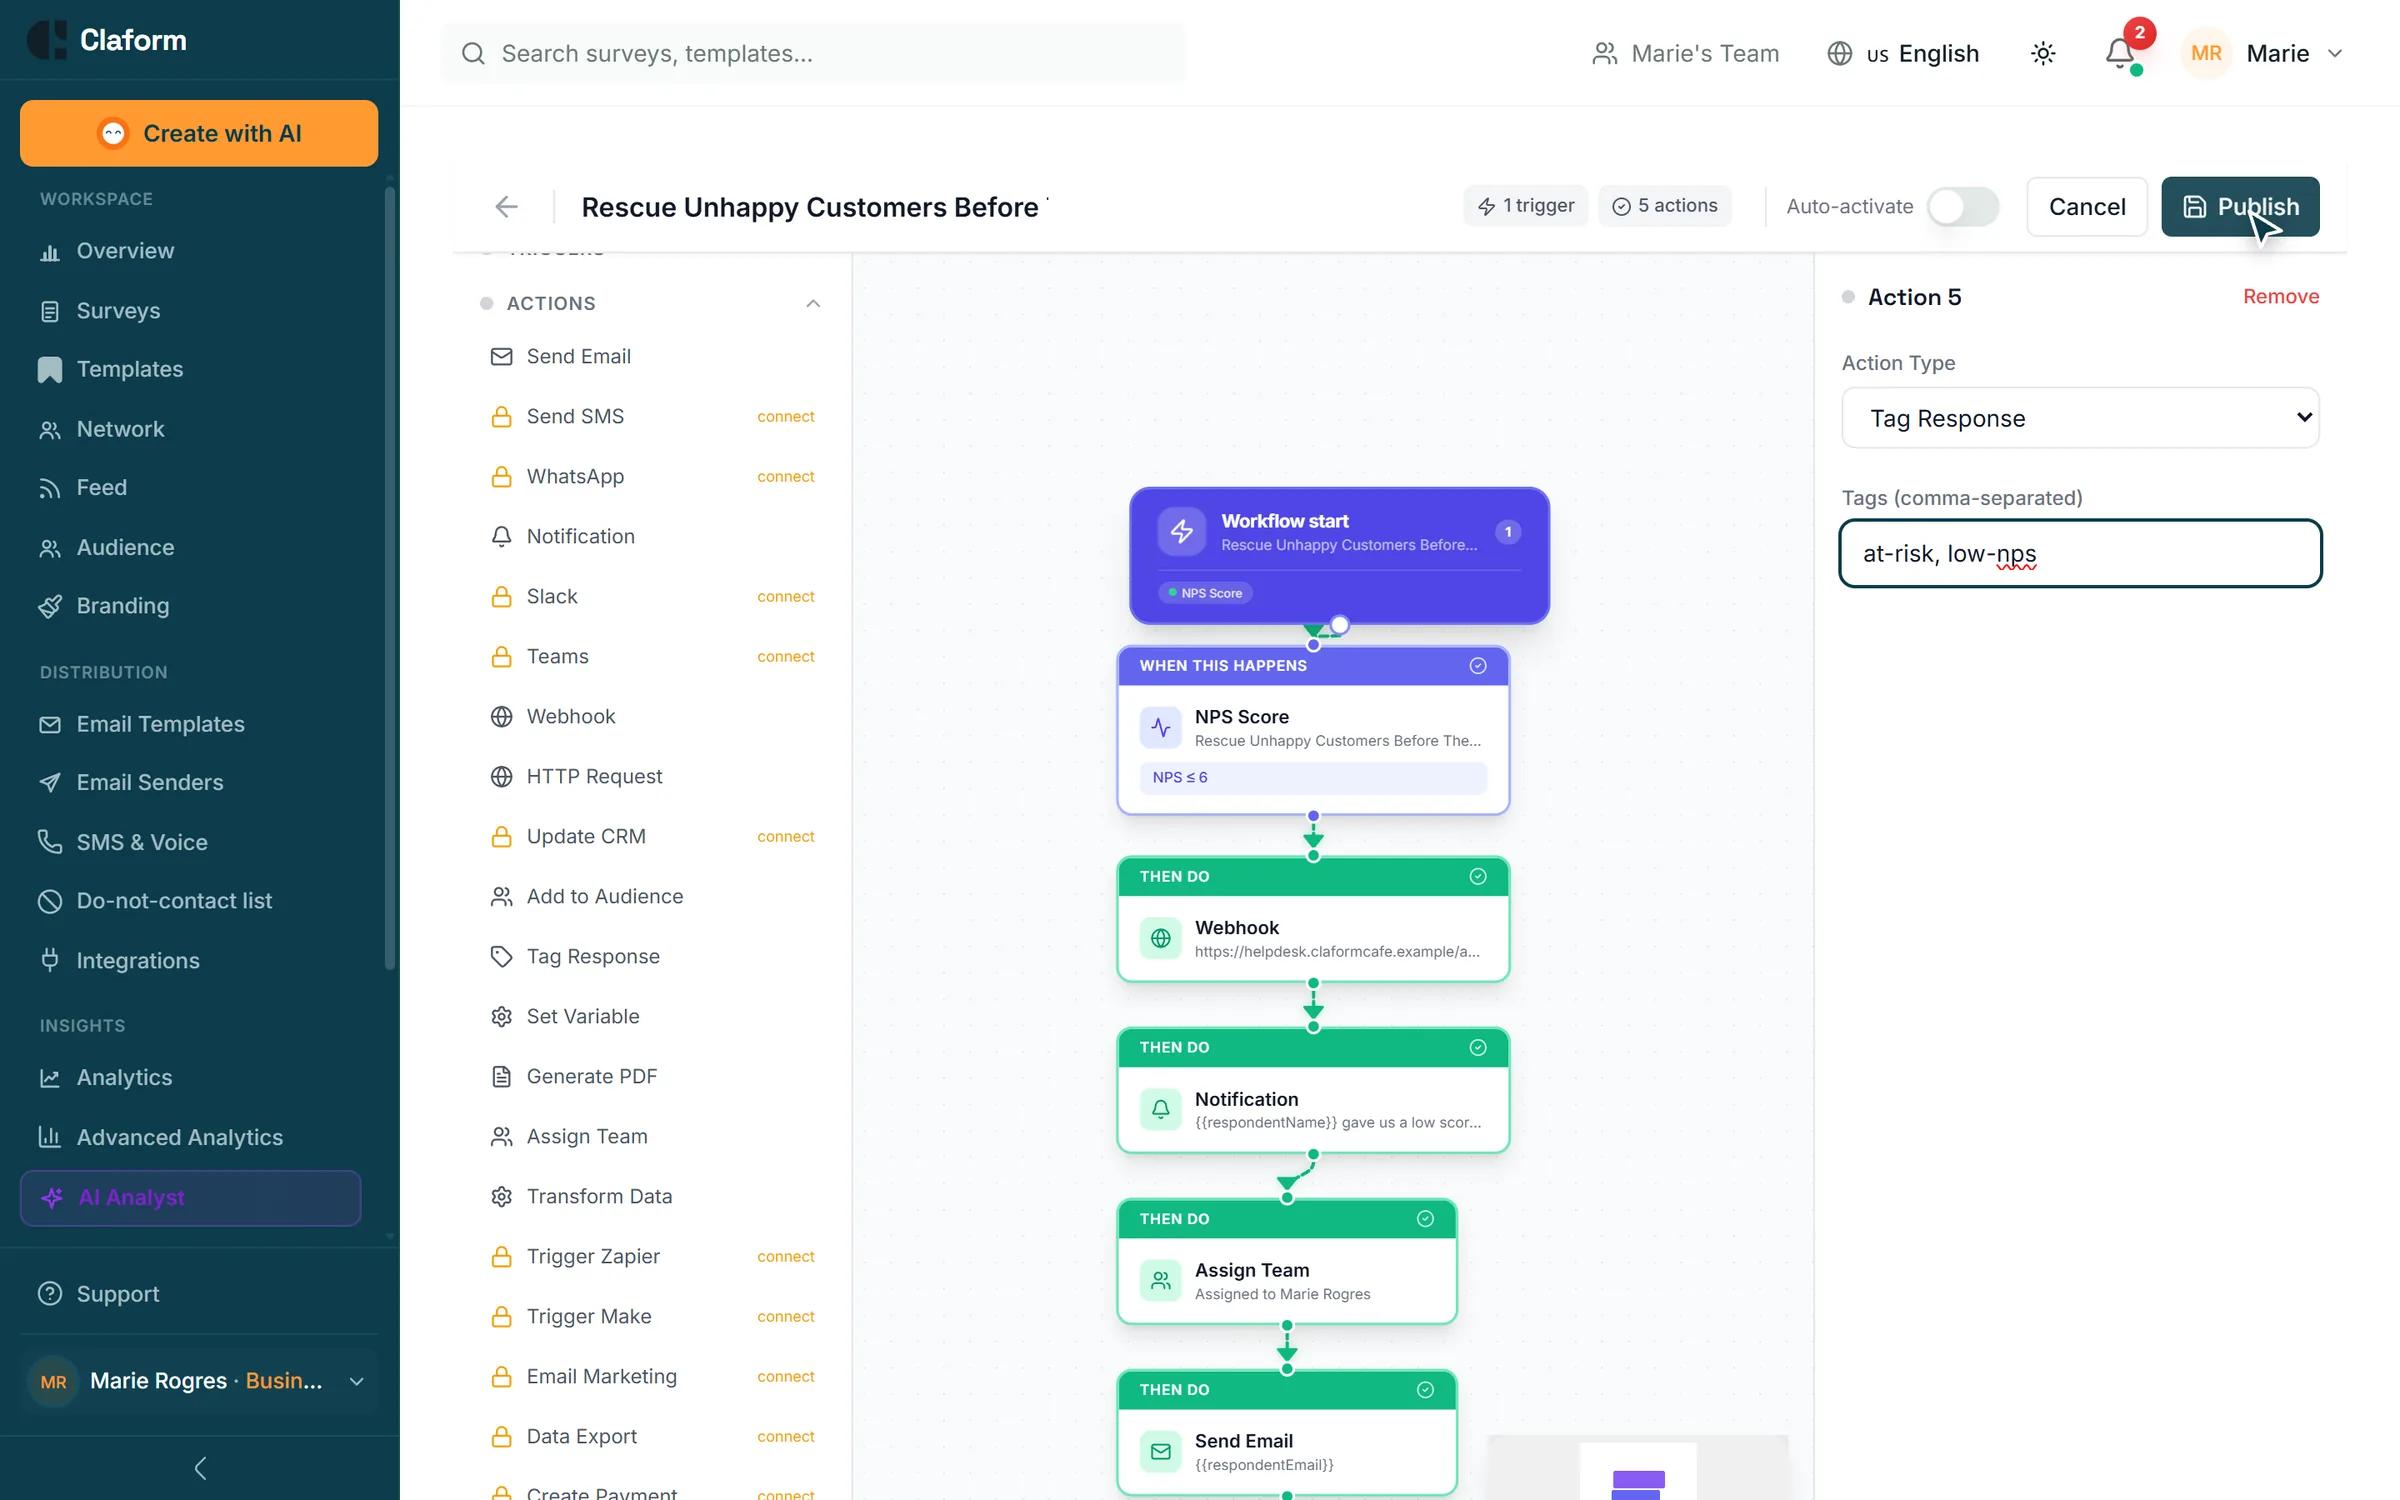 Turn a bad score into a fixActA low recommend score opens a ticket, alerts the team, names an owner and sends the guest an apology, tested on a sample answer first.See the scenario
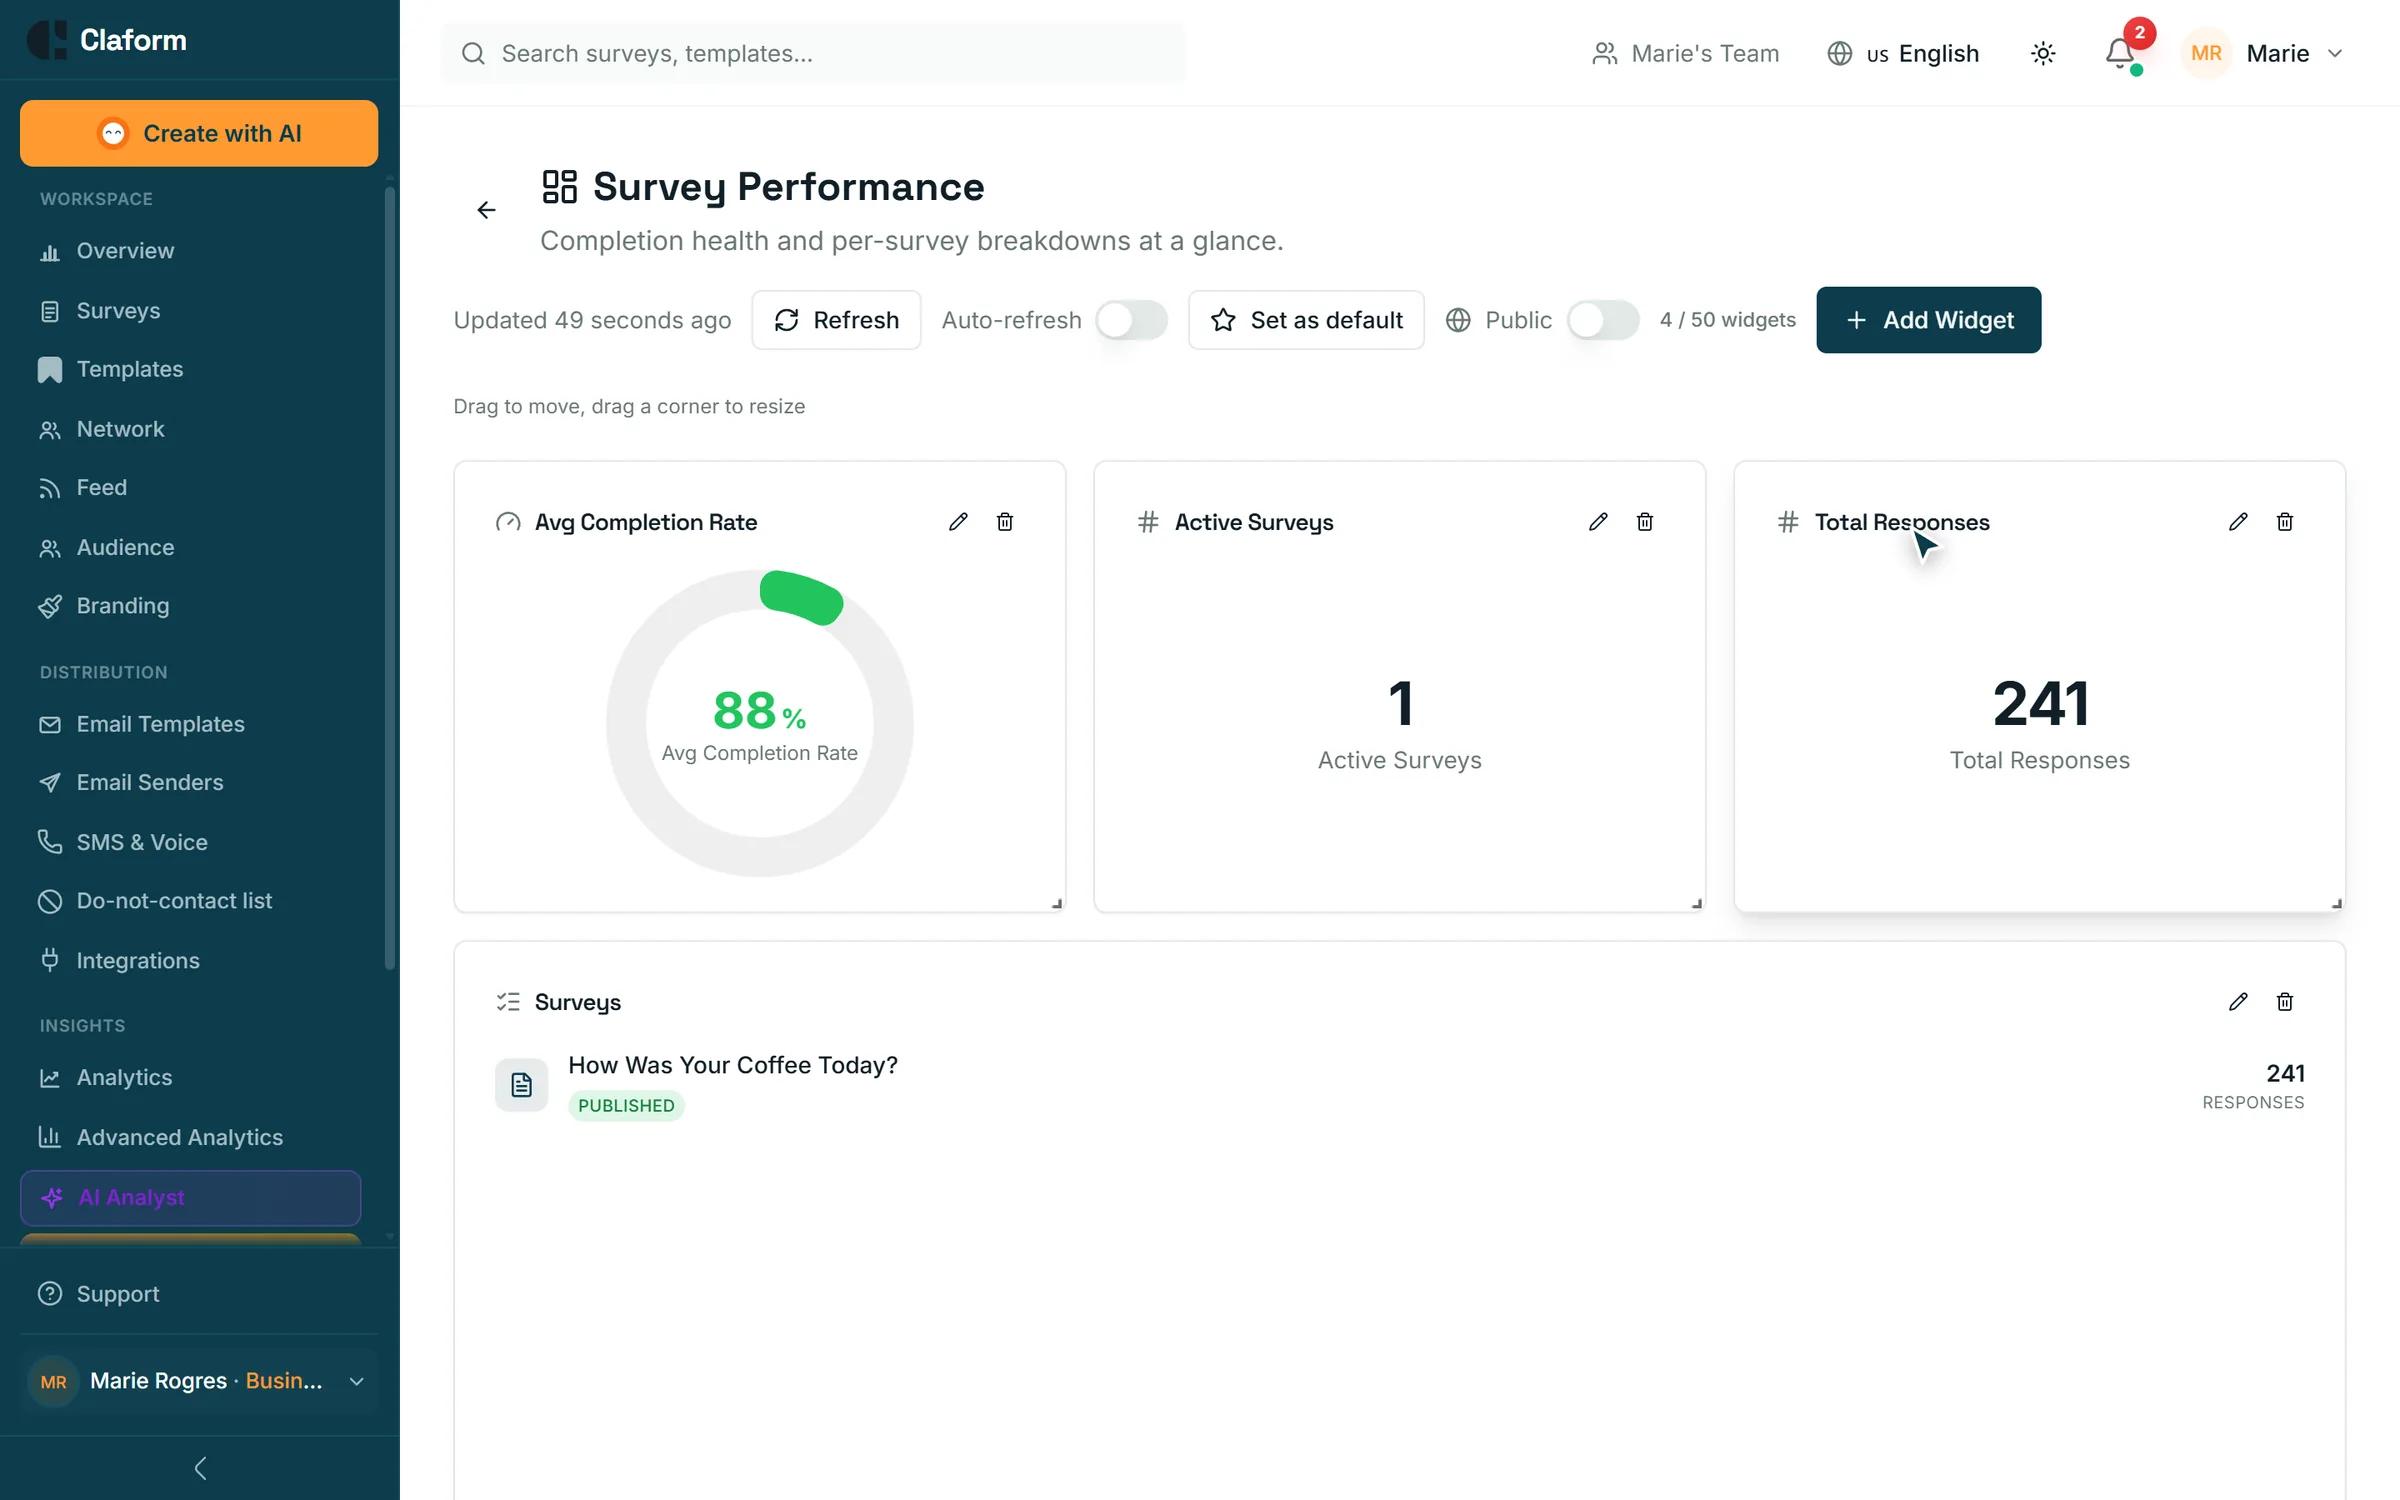 Give the whole team one screenShareThe NPS chart, the AI summary and the AI Analyst findings on one dashboard, plus the tools the team already uses.See the scenario
Try it with your own survey
Start free with no credit card, or ask us to become a launch customer.